
Key Takeaways
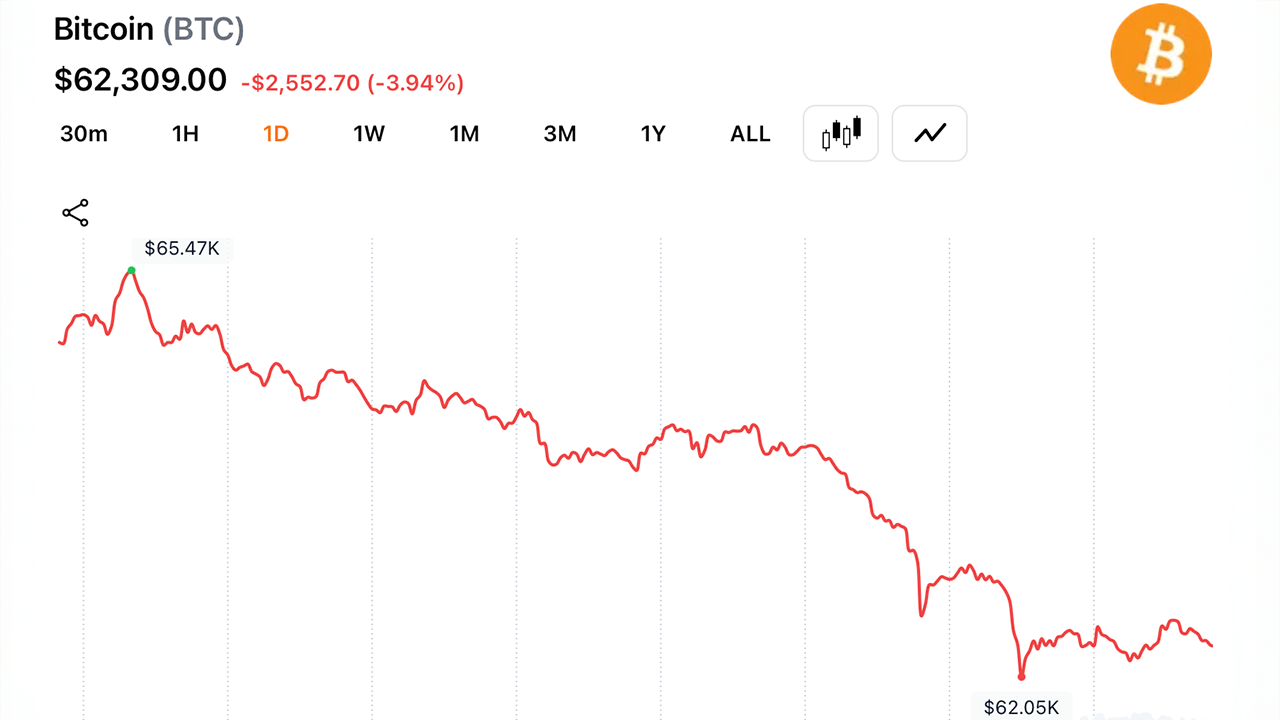
- Bitcoin traded at $62,309 on June 23, with all 14 moving averages signaling negative sentiment and price below the EMA (10) at $63,777.
- BTC’s RSI-14 reached 37, nearing oversold territory, while the MACD issued the session’s only bullish signal.
- A 4-hour close below $61,500 would open a path toward the $59,100 cycle low, per the current bearish structure.
1-Hour Chart: Consolidation and Lower Highs Define Short-Term Structure
On the 1-hour chart, bitcoin’s price action reflects a market under consistent selling pressure. A sharp selling impulse earlier in the session produced a series of lower highs and lower lows before price found a tentative floor in the $62,200 to $62,500 zone.
That consolidation has not yet produced a confirmed reversal signal. Traders watching the 1-hour timeframe are focused on a break above $62,800, the level required to establish a higher low.

Until that level is reclaimed with follow-through, the 1-hour structure remains consistently bearish. A short entry setup is considered more attractive from a trend-following standpoint, with a rejection off $62,800 to $63,200 targeting $61,800 and $60,500. Volume during the recent selling impulse was heavier than recovery volume, keeping sellers in the driver’s seat at this timeframe.
4-Hour Chart: Lower Highs Extend From Recent Peak Near $65,000
The 4-hour chart shows a clear sequence of lower highs extending from the recent peak near $64,800 to $65,000. Strong downturns with elevated volume accompanied that move lower, and price is now testing the $61,800 to $62,000 support band, a zone that has provided temporary footing but has not yet attracted meaningful buying power.

A bullish bounce setup exists if support holds, with targets at $63,500, $64,500, and $65,500. A 4-hour close below $61,500 would invalidate that scenario and confirm continuation of the larger bearish structure visible on the daily chart. The short-term 4-hour trend is bearish, and the current test of support is the decisive moment for swing traders positioning in either direction.
Daily Chart: Recovery From $59,100 Stalls Below $66,000 to $67,000 Resistance
The daily chart paints the clearest picture of where bitcoin stands structurally. Price bounced off a major swing low at $59,100, but the recovery has stalled in the $66,000 to $67,000 area, which has now become the line bulls must reclaim on a daily close to shift the broader outlook. Recent market action show rejection and a failure to print a higher high, which keeps the daily trend bearish.

The major swing high stands at $78,100, far above current levels. Support levels below the current price are layered at $62,000, then $60,000, and then the $59,100 cycle low. Bulls require a sustained daily close above $66,000 to $67,000 before a credible case for trend reversal can be made. Until that happens, the bounce from $59,100 reads as corrective rather than the start of a new uptrend.
Oscillators: RSI at 37, MACD Signals Bullishness, Momentum Remains Negative
Oscillators present a mixed but largely neutral picture on June 23. The relative Strength Index ( RSI) via the daily timeframe sits at 37, approaching oversold territory without yet triggering a confirmed reversal signal. The Stochastic reads 39 and is also neutral. The commodity channel index (CCI) on Tuesday morning stands at negative 37, and the average directional index (ADX) is at 35, indicating trend strength without a directional lean.
The daily timeframe’s Awesome oscillator tape reads negative 4,201, and the momentum indicator comes in at negative 1,988, both registering bearish signals. The one constructive reading comes from the daily’s moving average convergence divergence ( MACD) level, which sits at negative 1,997 and is flagging a bullish signal, a potential early inflection in momentum. The overall oscillator panel shows two negative signals, eight neutral readings, and one bullish, offering no strong directional conviction.
Moving Averages: All 14 Readings Signal Bearishness as Price Sits Below Every Key Level
The moving average (MA) tape is still unambiguous. All 14 moving averages are signaling bearishness, with zero bullish signals and one neutral reading. Bitcoin’s price is trading below every exponential moving average (EMA) and simple moving average (SMA) on the board. The nearest resistance sits at the EMA (10) at $63,777, followed by the SMA (10) at $64,232 and the EMA (20) at $65,021. Further overhead pressure builds at the EMA (50) at $68,777 and the SMA (50) at $71,463.
The longest-period averages, the EMA (200) at $77,534 and the SMA (200) at $76,452, represent the most significant structural barriers. Classic pivot analysis shows the primary pivot near $76,265 with support levels at $69,697 and $65,827. The overall technical reading for BTC on June 23 is fairly neutral but with a noticeable bearish tilt, and a reclaim of $63,777 on volume with RSI and MACD confirmation is the minimum threshold traders are watching for any shift in bias.
Bull Verdict:
Bitcoin’s RSI at 37 is pressing toward oversold territory, a condition that has historically attracted dip buyers before a meaningful bounce. The MACD level is the one indicator in the entire technical stack issuing a bullish signal, suggesting early momentum is shifting. The $61,800 to $62,200 support zone has held across multiple timeframes, and a confirmed break above $62,800 on the 1-hour chart followed by reclaim of the EMA-10 at $63,777 would set up a run toward $64,500 and $65,500.
Bear Verdict:
Every single MA on the board is pointing lower, from the SMA-10 at $64,232 all the way up to the EMA-200 at $77,534. The daily chart has failed to print a higher high, the recovery from the $59,100 low stalled below $67,000, and recent volume has been heaviest during the selloff, not the bounce. The 4-hour structure shows clear lower highs extending from the $65,000 peak, and a close below $61,500 removes the last credible near-term support. If that level fails, $60,500 and $59,100 are the next logical targets.


Leave feedback about this