

Bitcoin price has pulled back toward $65,700 after approaching $67,000, as caution before Alphabet’s earnings and a sharp oil rally pushed traders away from risk assets.
Summary
- Bitcoin price pulled back below $66,000 as tech earnings uncertainty and rising oil prices weighed on sentiment.
- ETF inflows remained positive, while BTC faced a key market structure test near $66,950.
- Losing $64,992 could expose deeper support, while a breakout may trigger liquidations toward $68,000.
According to data from crypto.news, Bitcoin (BTC) price traded near $65,970 at press time, down about 1.5% on the daily chart after reaching an intraday high of $66,886. The retreat followed a multi-day recovery from the July low near $58,000, but traders remained reluctant to chase the move before major technology companies released quarterly results.
U.S. stock futures edged lower on Wednesday as investors awaited results from Alphabet and Tesla. Alphabet faces particular scrutiny because Wall Street wants evidence that its heavy spending on artificial intelligence can produce durable returns. Analysts expect the company’s annual capital expenditure to reach between $180 billion and $190 billion, according to Reuters.
Semiconductor stocks have also experienced sharp swings over concerns that technology companies may curb AI infrastructure spending. Weakness in chipmakers could pressure the Nasdaq and drain demand for Bitcoin, which has retained a strong short-term correlation with high-growth equities during periods of market stress.
Meanwhile, U.S. spot Bitcoin exchange-traded funds recorded $203.2 million in net inflows on July 21, according to data compiled by Farside Investors. BlackRock’s IBIT led with $163.9 million, while Fidelity’s FBTC added $23.1 million. The total fell from $226.8 million in the previous session, leaving institutional demand positive but insufficient to push BTC through the June high.
Bitcoin price needs a daily close above $67,000
Bitcoin’s 4-hour chart places $66,950 at the top of the recovery range that began from the July 1 low of $57,799. Buyers briefly approached that boundary on Tuesday before profit-taking pulled the price back below $66,000.
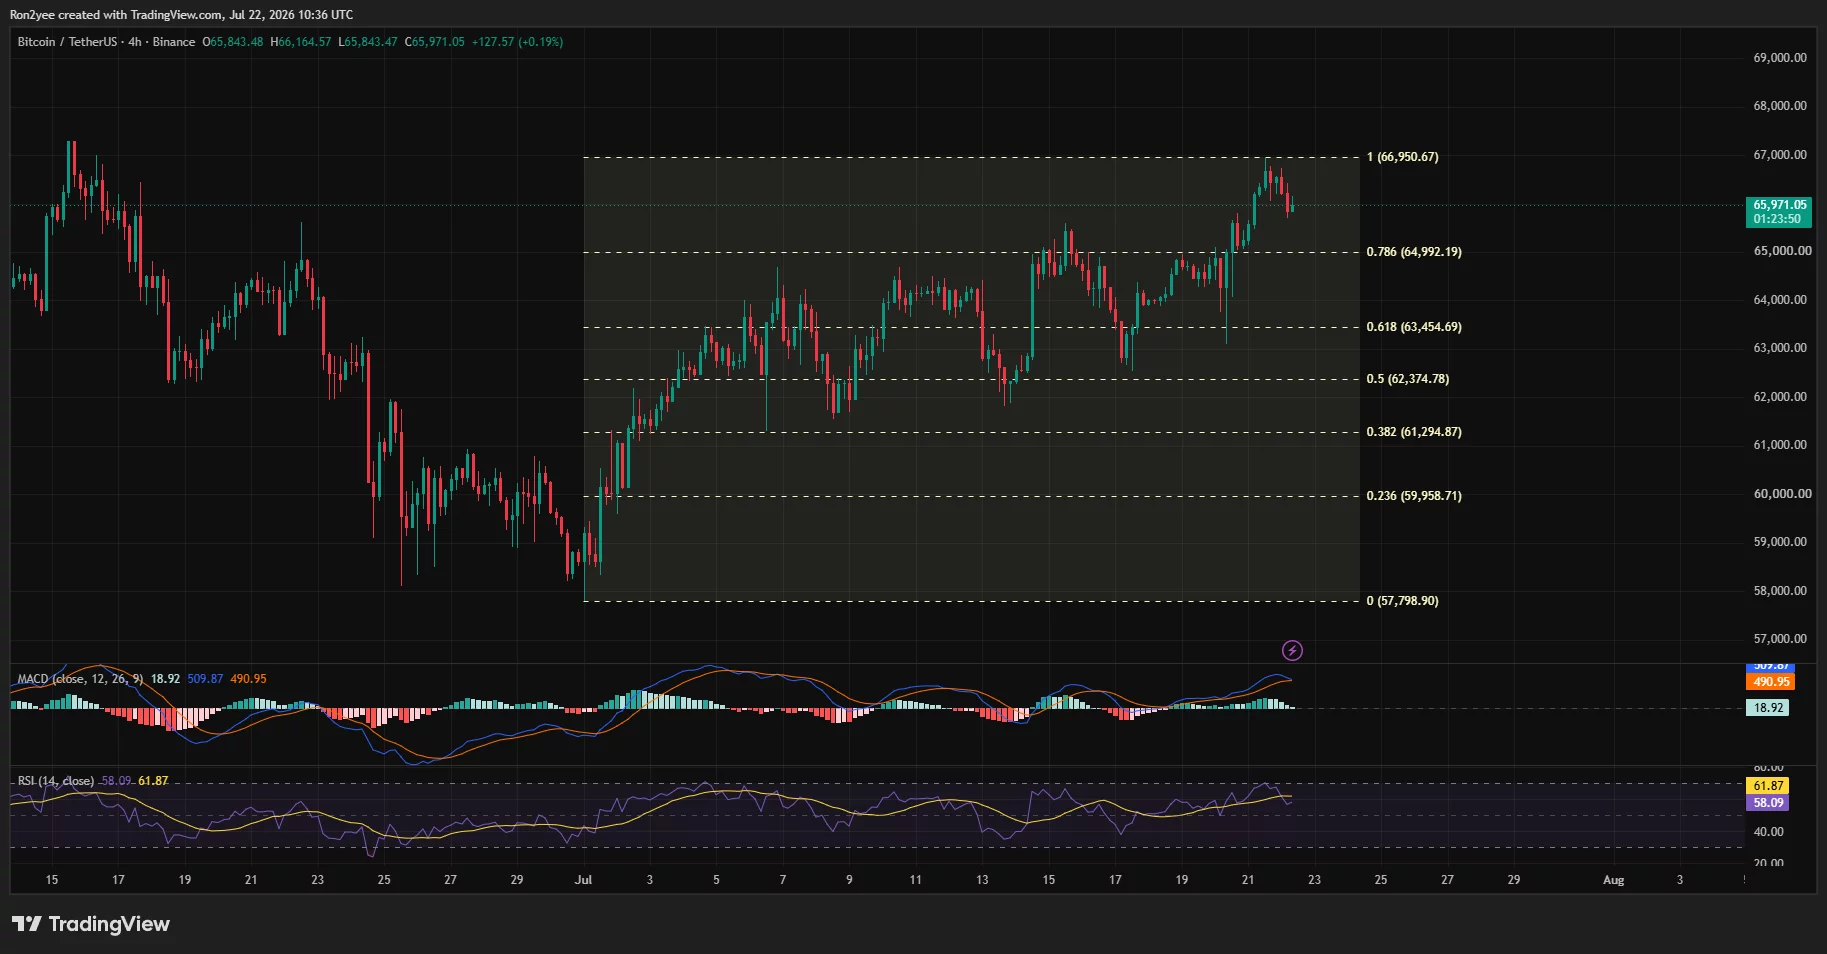
A confirmed close above $66,950 would produce Bitcoin’s first daily higher high since the May rally and could turn $67,000 into support. According to trader Daan Crypto Trades, a break above the June high would establish “a daily bullish market structure break,” opening the path toward higher levels.
The daily chart offers another constructive signal. BTC remains above the 20-day and 50-day simple moving averages at $64,065 and $63,135, respectively. Those averages now form the first dynamic support area, while the Chaikin Money Flow reading of 0.13 shows that capital inflows have exceeded outflows during the latest recovery.
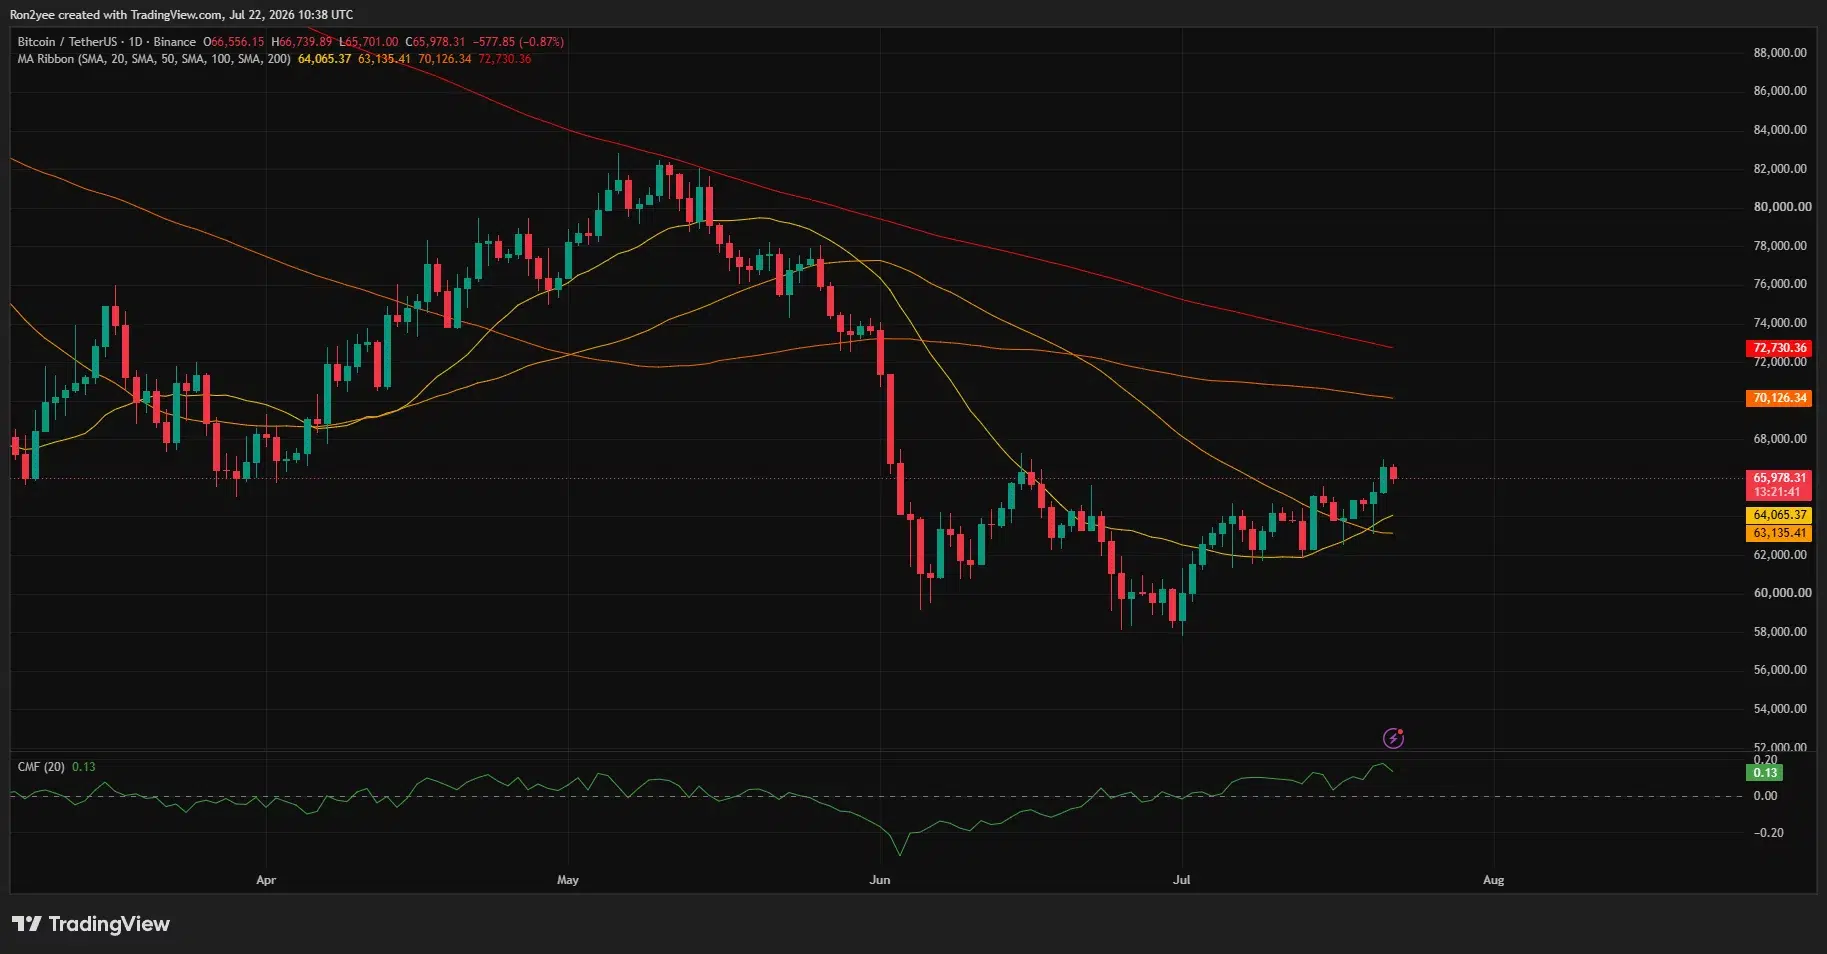
Longer-term resistance remains much higher. Bitcoin trades below the 100-day SMA at $70,126 and the 200-day SMA at $72,730, which means the daily trend has not fully reversed. A sustained move above those averages would expose the $76,000 region and reduce the influence of the decline from May’s peak near $82,000.
Analyst Ted Pillows also noted that Bitcoin’s daily Supertrend has flipped from bearish to bullish. Comparing the setup with the previous signal, Pillows wrote:
“Last one pumped Bitcoin by almost 15% in 4 weeks. A similar pump means BTC will hit $76,000 by August.”
Momentum remains positive but has lost some strength after the rejection. The 4-hour relative strength index has dropped to 58.09 from above 60, keeping BTC out of overbought territory. MACD remains above its signal line, although the shrinking positive histogram shows that buyers have reduced the pace of accumulation.
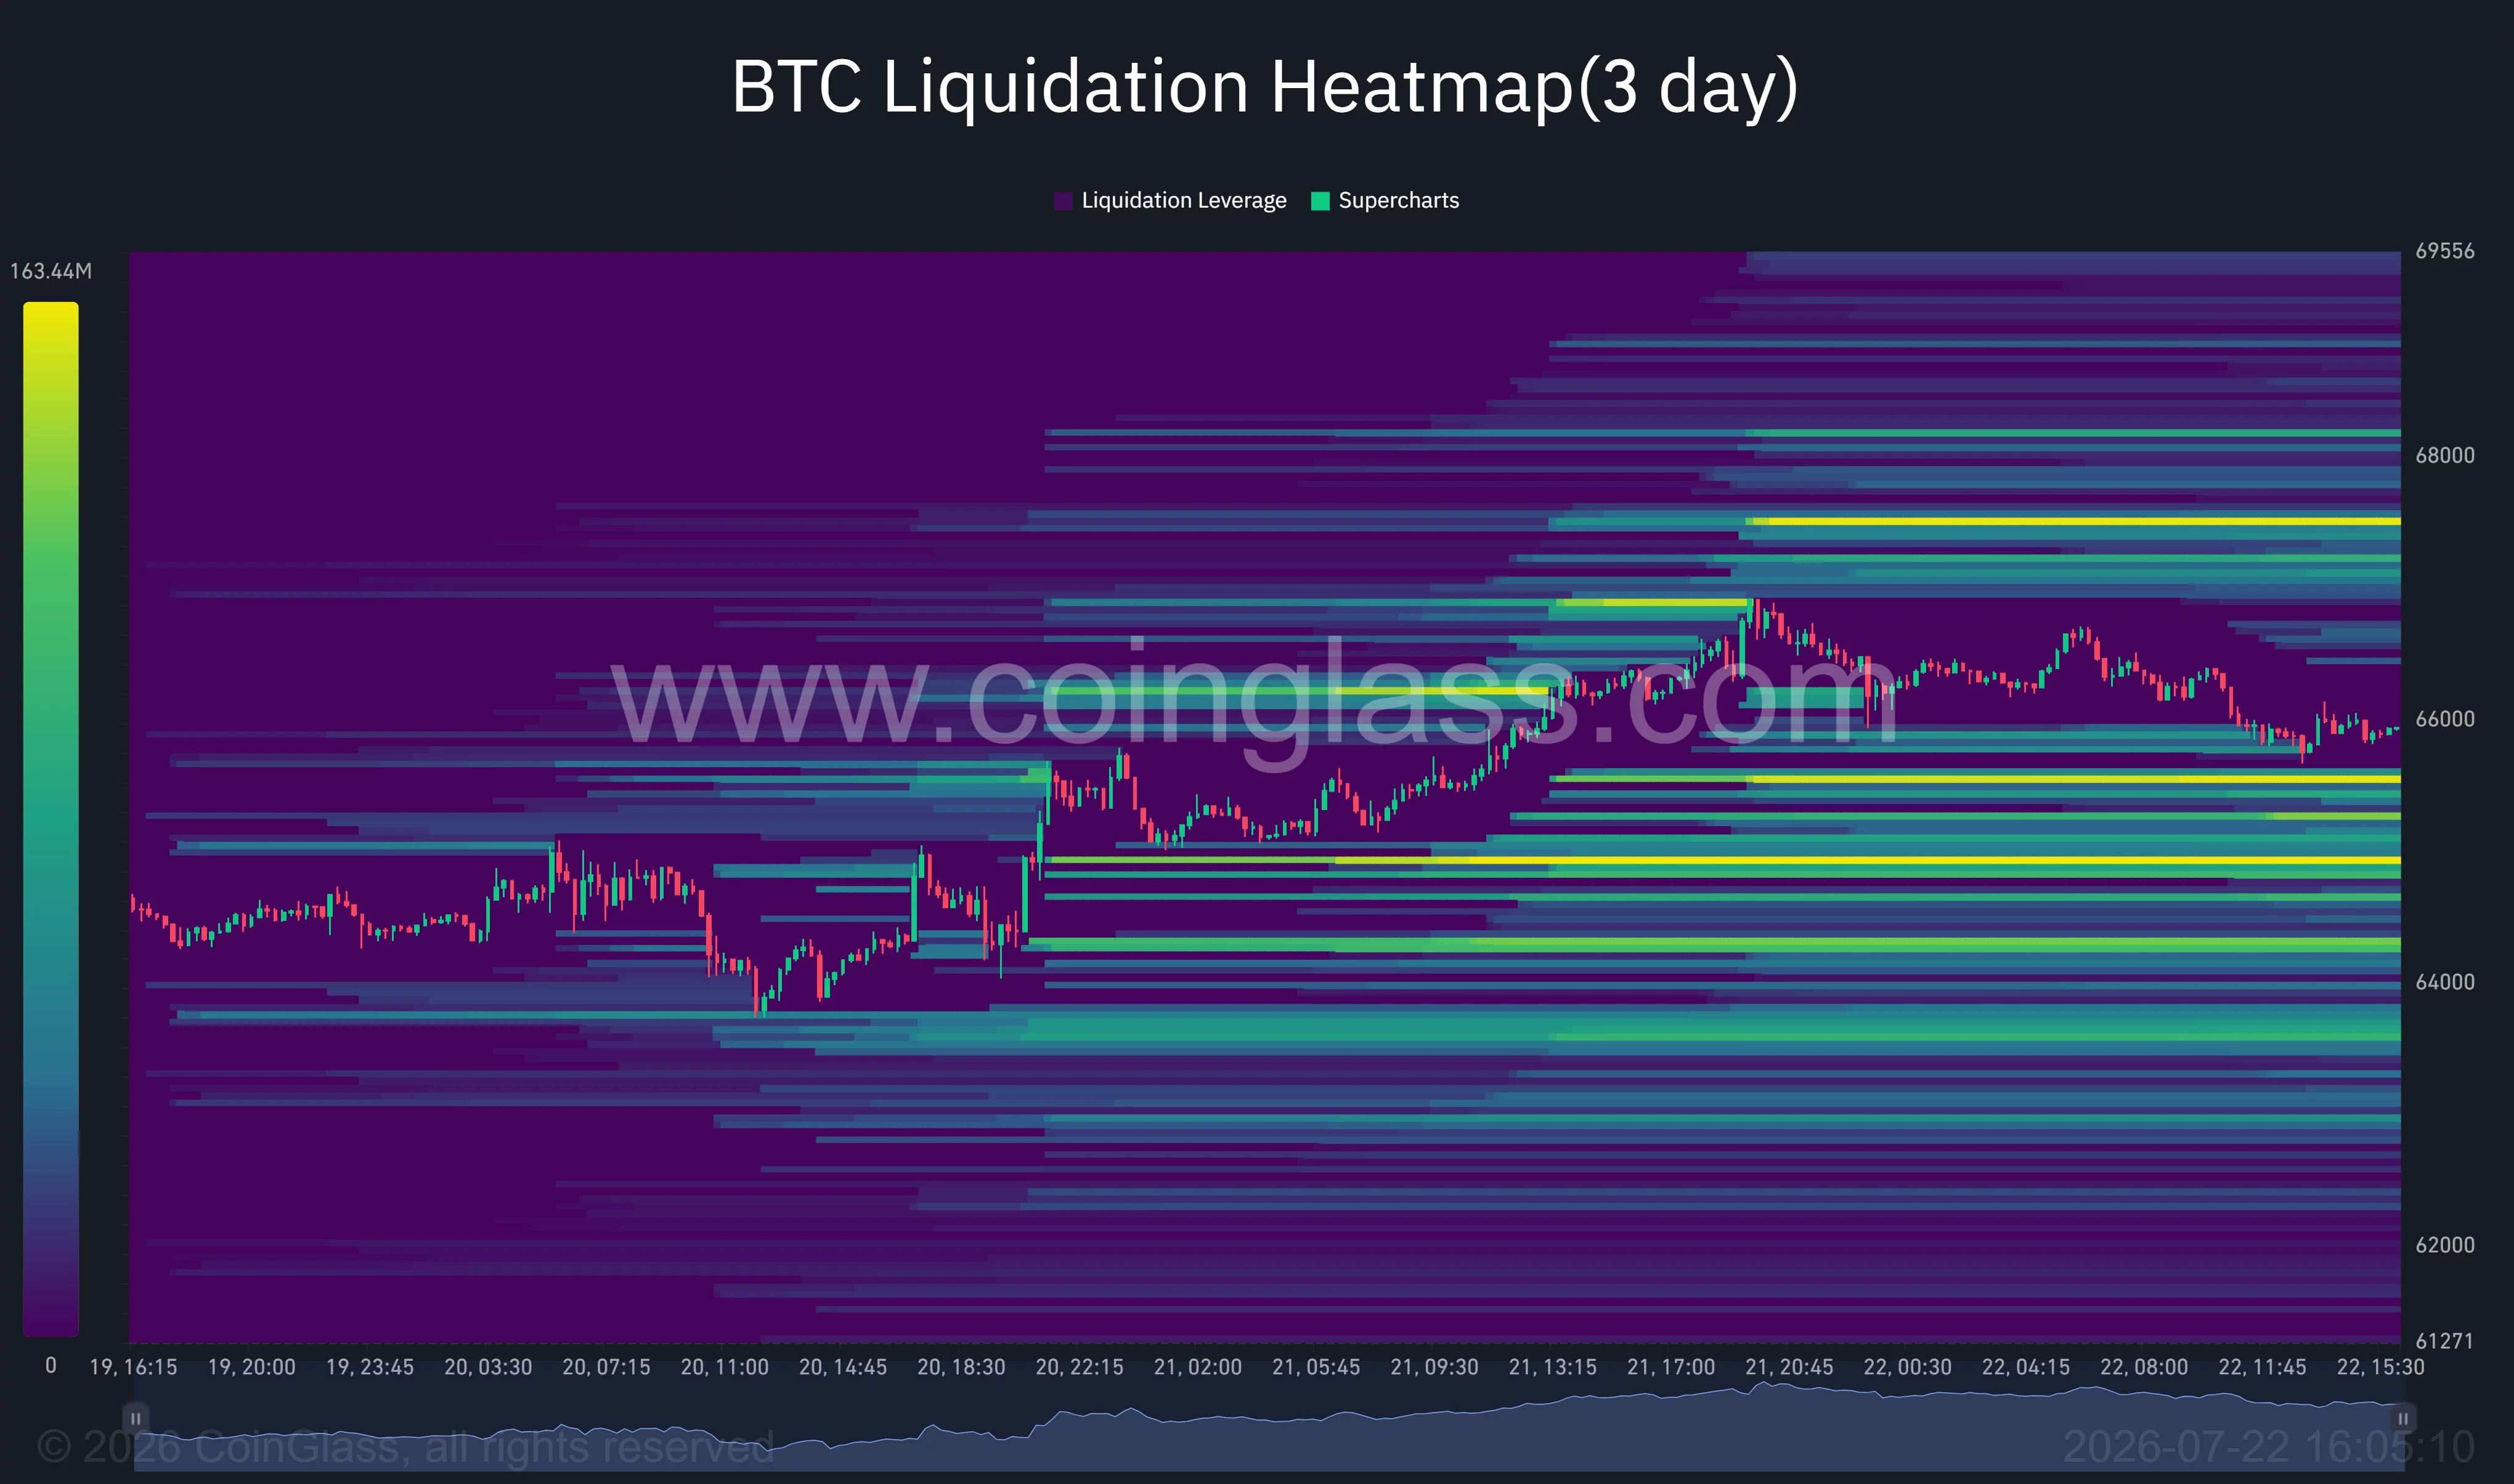
CoinGlass’ three-day liquidation heatmap places the largest nearby short-liquidation pool around $67,300, with another dense band near $68,000. A move through $66,950 could force leveraged sellers to close positions and provide the momentum needed to test both zones. On the downside, long-liquidation clusters sit near $65,500, $64,700 and $64,300.
Oil and Federal Reserve risks threaten the recovery
WTI crude surged more than 4% to $87.99 on Wednesday, while Brent climbed above $94, after escalating U.S.-Iran tensions raised concerns about supply routes. President Donald Trump dismissed immediate negotiations with Tehran and threatened further action against the suspected nuclear facility at Pickaxe Mountain. Houthi threats against shipping have added risks around the Red Sea and Bab el-Mandeb Strait.
Higher energy costs could prolong inflation and restrict the Federal Reserve’s ability to support markets. A July poll found that economists expect the Fed to hold its 3.50%–3.75% policy rate through 2026, though more respondents now see a high chance of an increase. Expensive oil and elevated Treasury yields would raise the hurdle for speculative assets such as Bitcoin.
A 4-hour close below the 78.6% Fibonacci level at $64,992 would weaken the current recovery and expose $63,455, followed by $62,375. Losing the daily moving-average cluster near $63,100 would invalidate the immediate bullish setup and could return BTC to $61,295.
For the upside case to remain intact, Bitcoin must defend $65,000 and close decisively above $66,950. Until then, oil prices, Alphabet’s earnings, and leveraged positioning leave BTC vulnerable to another sweep of liquidity below the current range.
Disclosure: This article does not represent investment advice. The content and materials featured on this page are for educational purposes only.






Leave feedback about this