
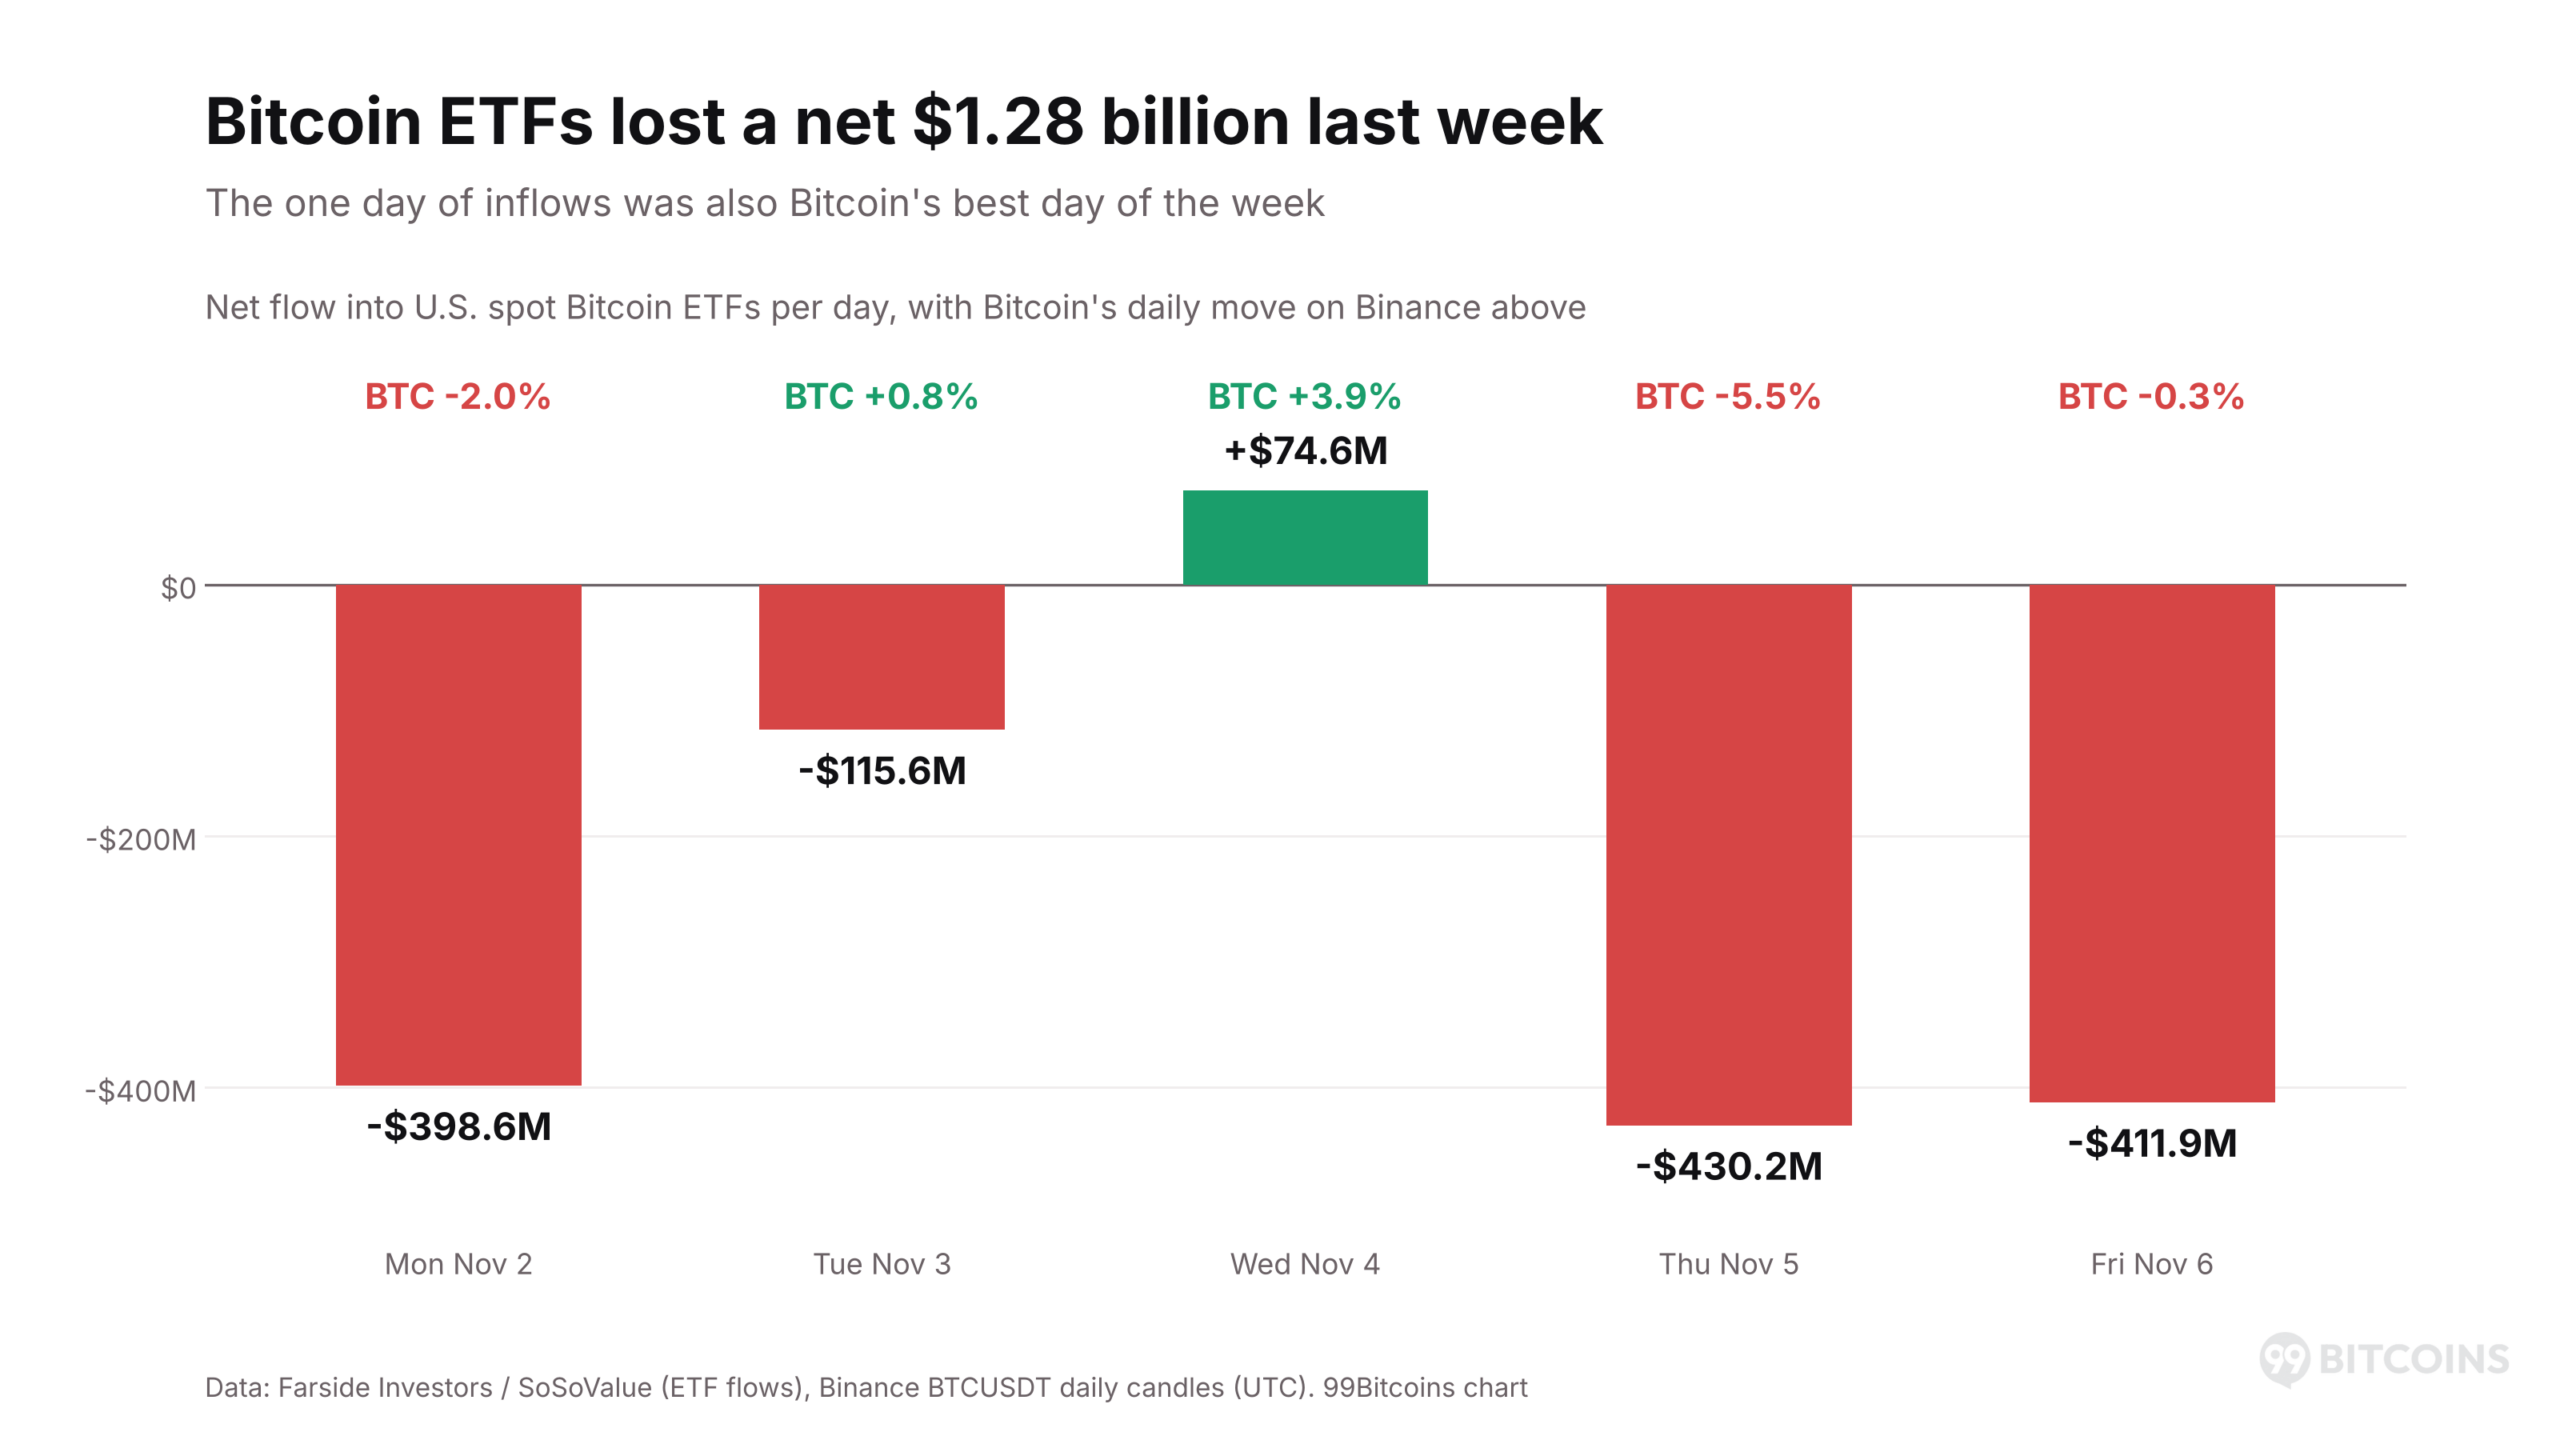
Bitcoin (BTC USD price) fell to $73,510 on Binance late Sunday, its lowest price since August 21. It came after a week in which investors pulled a net $1.28 billion out of U.S. spot Bitcoin exchange-traded funds (ETFs).
The two moves fed each other. ETF holders sold through the week, and on Sunday evening a wave of forced selling by leveraged traders took Bitcoin down 2.8% in ten minutes.
BTC trades at $74,224 on Monday morning, down 0.8% on the day. Sunday’s drop also sealed a fifth straight losing week and the first weekly close below the 50-week average in two months.
The mood is weak. The Fear & Greed Index, a daily gauge of market sentiment from 0 to 100, read 29 on Monday morning, which counts as fear.
So is the selling done, or does Bitcoin have further to fall?
BREAKING: Bitcoin's weekly candle just closed below the 50-week MA for the first time in 2 months.
Two paths from here:
1) If the bulls push Bitcoin back above the 50-week MA this week, it confirms a classic fakeout designed to trigger panic sells.
2) If we see another weekly… pic.twitter.com/SY5BEjcCvU
— Ash Crypto (@AshCrypto) November 9, 2026
DISCOVER: 9+ Best High-Risk, High-Reward Crypto to Buy in 2026
ETF Selling Lined Up With Bitcoin’s Worst Days: Sunday’s Cascade Ranked Among the Year’s Sharpest Five-Minute Drops
The funds had a losing week. Farside Investors, which tracks the funds’ daily flows, counted net outflows on four of the five trading days from November 2 to 6. A net $1.28 billion left in all.
- Monday, November 2: $398.6 million out, as BTC fell 2.0%.
- Tuesday: $115.6 million out, even though BTC rose 0.8%.
- Wednesday: $74.6 million in, the only day of inflows, as BTC gained 3.9%.
- Thursday: $430.2 million out, the biggest exit of the week, as BTC fell 5.5%.
- Friday: $411.9 million out, with BlackRock’s IBIT fund behind $403 million of it.

These flows are real buying and selling. When investors pull money out of a spot ETF, the fund sells Bitcoin to pay them, so four days of exits meant steady selling into the weekend.
Then came Sunday. At 21:44 UTC, BTC sat at $75,607 on Binance. Eleven minutes later, it touched $73,510. The worst came in the five minutes from 21:55 UTC, when Bitcoin fell 1.9%. We checked every five-minute candle on Binance over the past year, 105,127 of them, and only ten fell harder.
It had the marks of a liquidation cascade, a chain of forced sales. Traders who borrow to bet on higher prices get their positions force-closed when the price falls past a set point. Each forced sale pushes the price toward the next batch.
Ethereum went first. ETH fell 6.9% on Binance between 21:50 and 21:55 UTC, almost three times Bitcoin’s 2.4% over the same minutes.
The headlines gave traders a reason to cut risk. Earlier on Sunday, CNBC reported that Nvidia’s board had opened an investigation into CEO Jensen Huang’s relationship with a woman U.S. intelligence agencies believe was passing information to Beijing. With stock markets closed, crypto was the only market open to sell.
Thin weekend trading made it worse. A typical weekend hour on Binance trades about half as much BTC as a weekday hour, so the same selling moves the price further.
EXPLORE: Bitcoin Price Stalls as Gold Surges: Is a Major Crypto Catch-Up Rally Coming?
A Fifth Red Weekly Candle Closed Below the 50-Week Average
Sunday’s drop did its biggest damage on the weekly chart. The weekly candle closed at $74,851, below its opening price of $78,354, making it Bitcoin’s fifth losing week in a row.
It also closed below the 50-week simple moving average (MA), the average of the last 50 weekly closes, which sits at $75,535. That is the first weekly close below the line since the week of September 7, two months ago.
Five straight losing weeks are rare. In Binance’s weekly data since August 2017, Bitcoin had strung together five or more only three times before. Each time, BTC traded below its fifth weekly close within the next 12 weeks:
- November 2018: it fell another 23% before the low.
- April 2022: it fell another 54%.
- February 2026: it fell another 8%, then ended the 12 weeks 15% higher.
Three cases are a small sample. Still, in all three, the low came after the fifth red week, not at it.
BTC USD Price Analysis: Can Bitcoin Hold $73,510?
For now, yes, but only just. BTC USD bounced to $75,735 within two hours of Sunday’s low and has since slipped back to $74,224, about 1% above it.
On the four-hour chart, where each candle covers four hours, Bitcoin trades below both of its exponential moving averages (EMAs), averages that weight recent prices more. The 50-period EMA sits at $76,845 and the 200-period EMA at $79,444.
- Resistance: $75,735, Sunday’s rebound high, then $76,845, the 50-period EMA. Above that, $79,444, the 200-period EMA.
- Support: $73,510, Sunday’s low. Below that, $73,027, the August 21 low.

| Path | What has to happen | Next stop |
|---|---|---|
| Push higher | A close back above $75,735 | $76,845, the 50-period EMA |
| Stall | BTC holds between $73,510 and $75,735 | A range below both EMAs |
| Slip | A close below $73,510 | $73,027, the August 21 low |
BTC USD traders will watch Monday’s ETF flows first. Another day of outflows would mean the funds are still selling into a weak market.
DISCOVER: 15+ Upcoming Coinbase Listings to Watch in 2026
Follow 99Bitcoins on X For the Latest Market Updates, and Subscribe on YouTube For Daily Expert Market Analysis.
The post BTC USD Breaks Below 50-Week Average After $1.28B ETF Outflows: Is The Selling Finally Over? appeared first on 99Bitcoins.






Leave feedback about this