

Bitcoin has edged back above $76,000 on Nov. 7, but weak daily momentum and another $411.9 million in U.S. spot ETF withdrawals have left its recovery close to a key weekly support level.
Summary
- Bitcoin traded near $76,070, with daily RSI below neutral at 38.78.
- The 50-week moving average near $75,562 sits just above the $75,000 weekly pivot.
- Liquidation clusters surround the market, with nearby overhead concentrations around $76,500–$77,500.
- U.S. spot Bitcoin ETFs lost approximately $1.28 billion across the Nov. 2–6 trading week.
According to the daily price chart, Bitcoin traded at $76,070 at 09:31 UTC, up 0.30% during Saturday’s daily session. The price had moved between $75,790 and $76,250, a relatively narrow range after the week’s failed recovery above $80,000.
Earlier this week, Bitcoin’s move above that threshold coincided with $378.09 million in hourly short liquidations, as crypto.news previously reported. By Saturday, the cryptocurrency was roughly 5.5% below the $80,470 price recorded during that rally.
Bitcoin holds weekly support as daily momentum stays weak
The weekly chart placed Bitcoin at $76,085, down 2.90% from its weekly opening price of $78,354. A high of $81,196 and low of $74,888 showed how much ground the market had covered before settling back near $76,000.
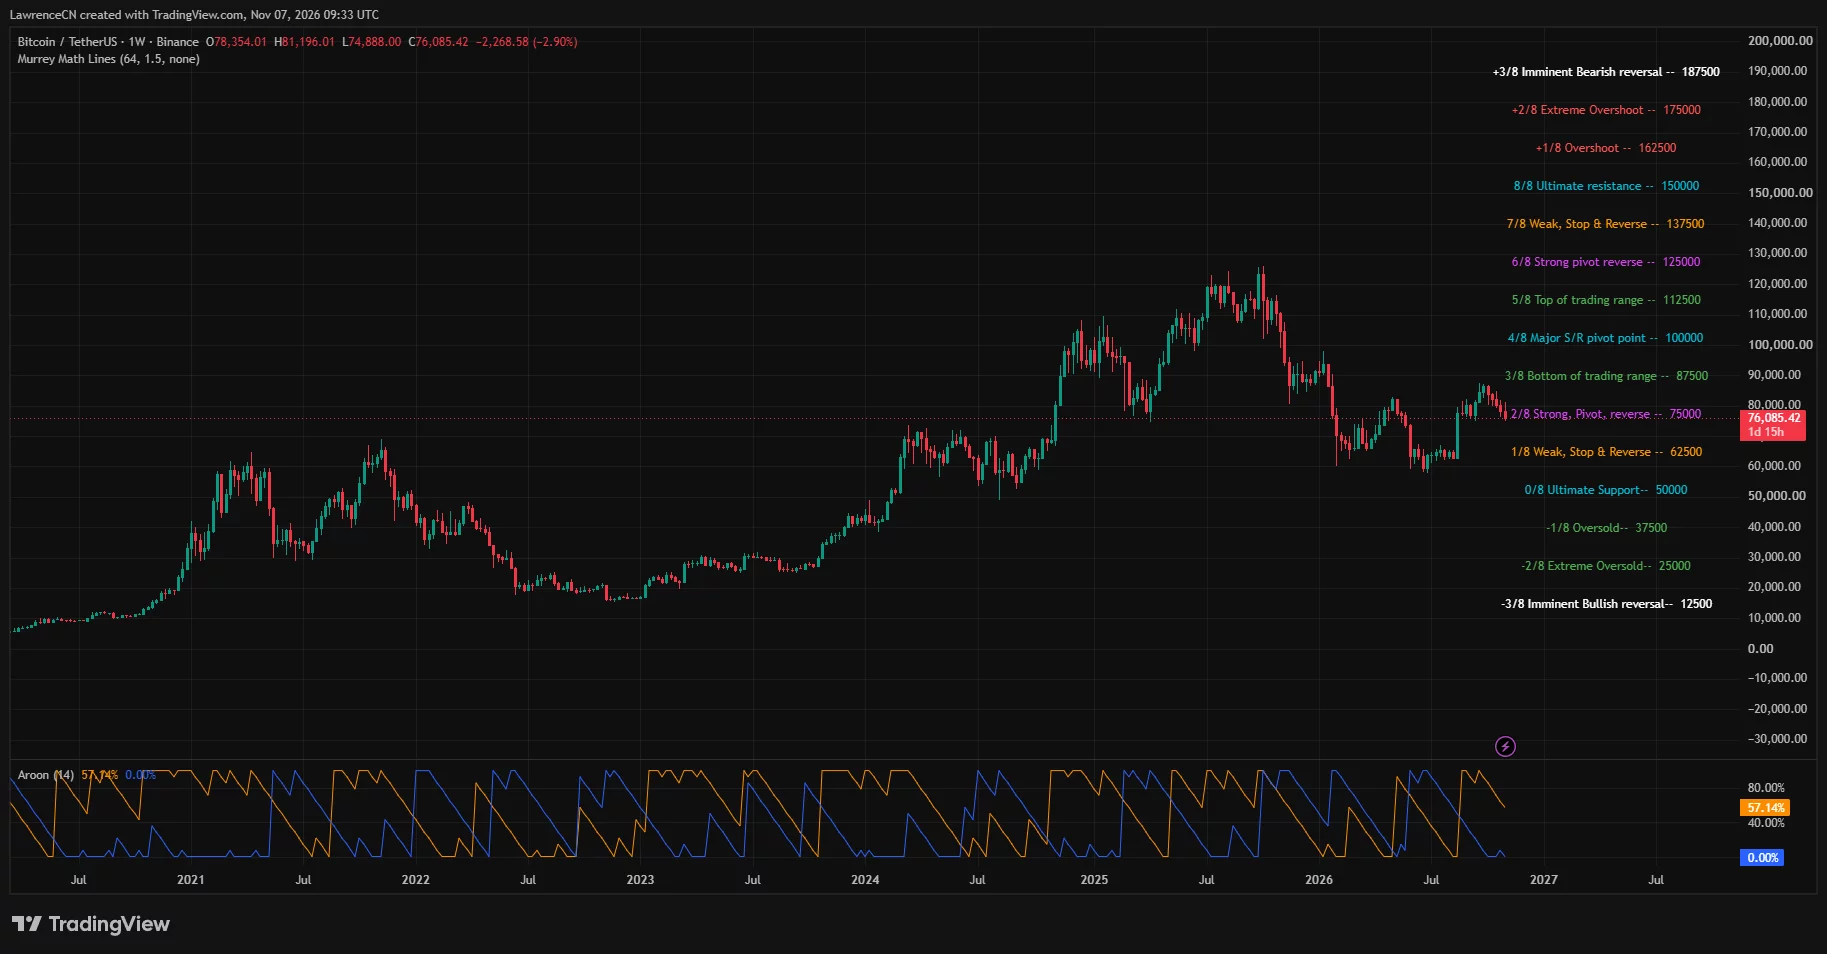
Despite briefly trading below the $75,000 Murrey Math pivot, Bitcoin remained above it in the Saturday snapshot. The weekly candle was still open, leaving the final position relative to that level unsettled.
In a Nov. 7 post, market commentator Max Crypto identified the 50-week moving average as the key level to watch. His chart placed the average at $75,561.73, leaving Bitcoin less than 1% above it.
“Hold it, and bulls will be in control,” he wrote, warning that losing the average could bring further weakness.
Daily indicators offered less encouragement. Bitcoin remained below the middle Bollinger band, its 20-day simple moving average, at $79,459.22. The lower band stood at $74,660.74, placing another technical reference just beneath the weekly pivot.
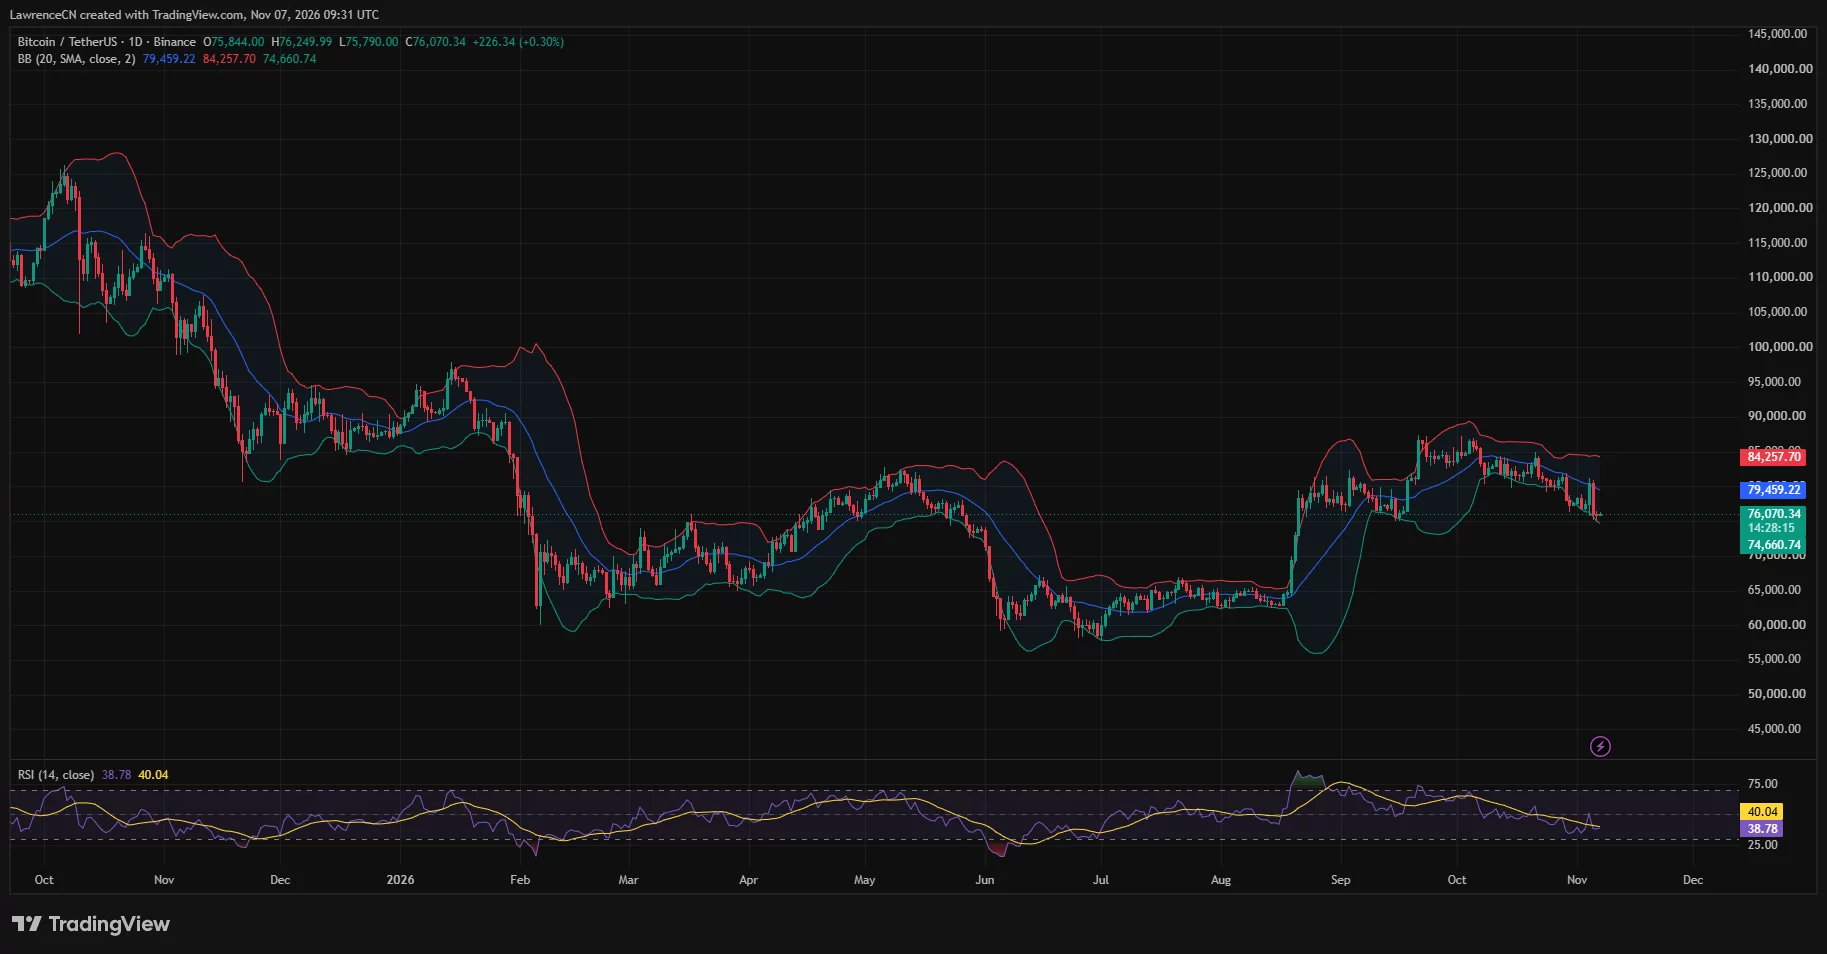
At 38.78, the daily relative strength index remained below both the neutral 50 level and its own average of 40.04. Momentum was weak, although the reading remained above the conventional oversold threshold of 30.
The price had improved from Friday’s $75,799 chart reading, when Bitcoin was defending the same support area. Over that interval, however, the middle Bollinger band fell from approximately $79,759, showing that the modest rebound had not reversed the declining daily average.
The upper daily Bollinger band stood at $84,257.70, above both the failed $80,000 recovery and the nearest liquidation concentrations. On the weekly Murrey Math grid, the next labeled level beneath $75,000 was $62,500.
Liquidation concentrations sit above and below $76,000
CoinGlass’s three-day liquidation heatmap showed nearby overhead concentrations around $76,500–$77,500. Bitcoin would encounter that zone before reaching the daily moving average, which stood roughly 4.5% above Saturday’s chart price.
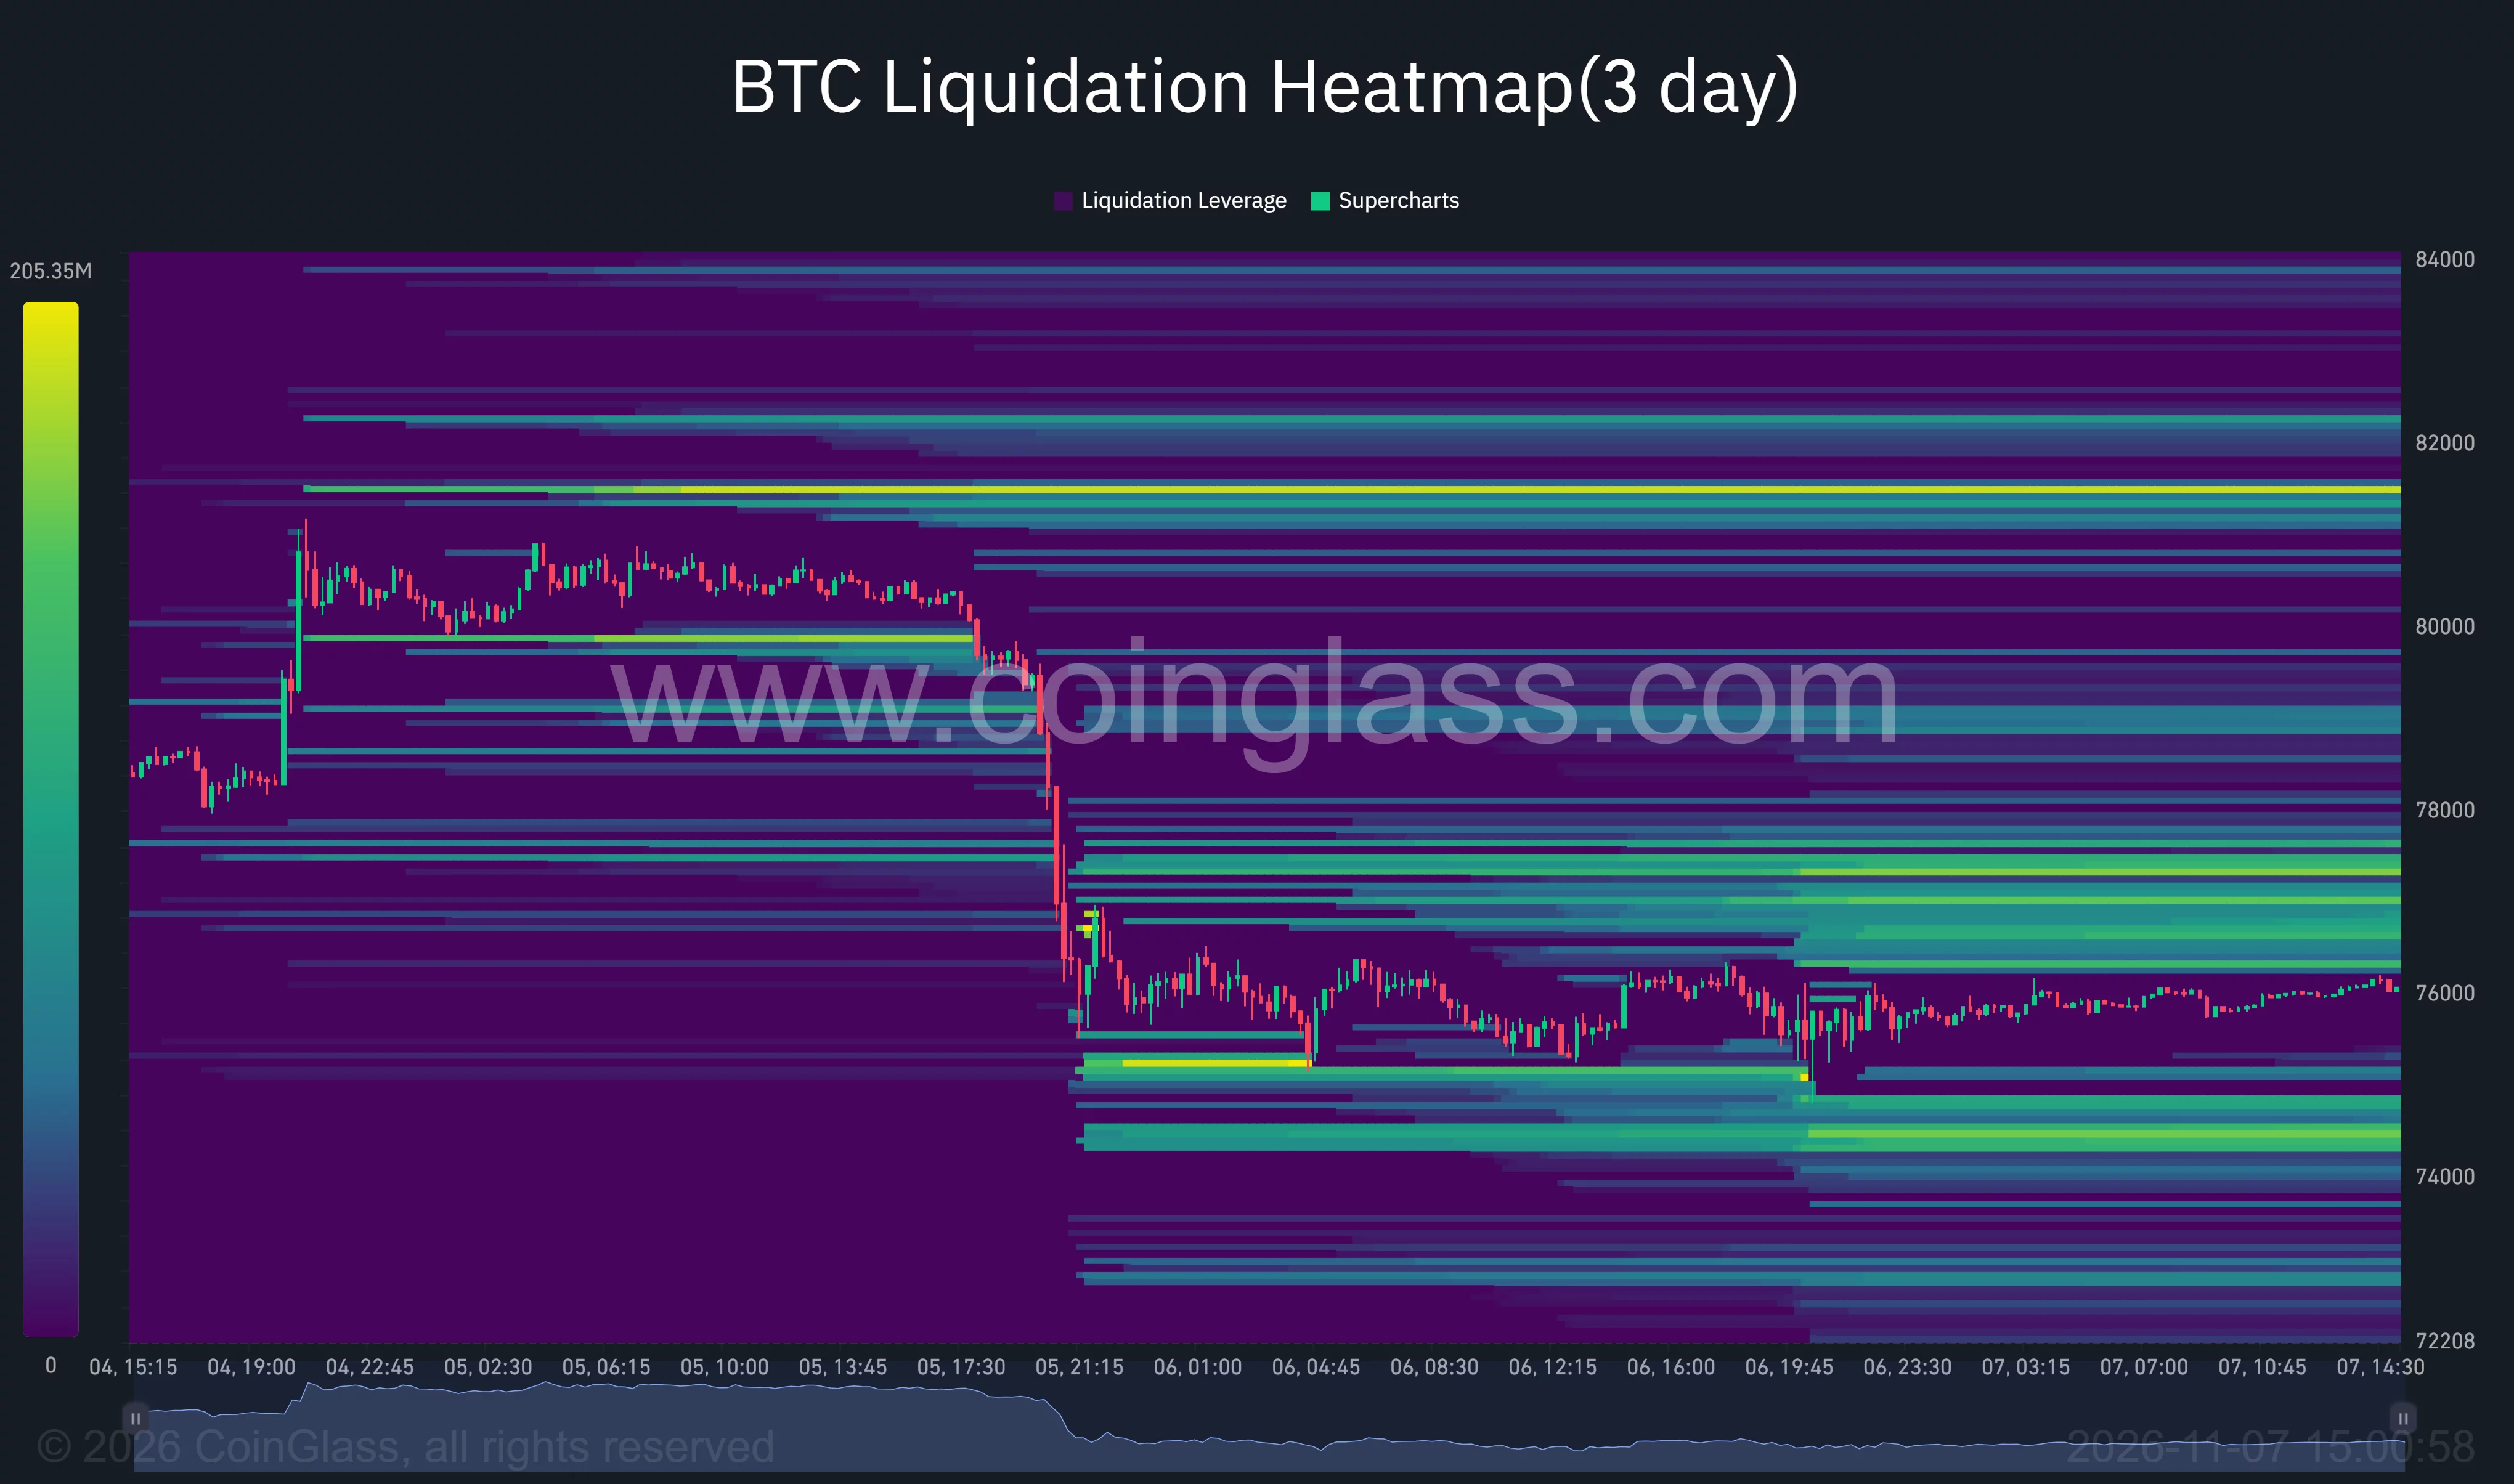
Farther overhead, a prominent band appeared around $81,400–$81,600, with another concentration near $82,200. Both remained above the week’s latest high.
Below the market, visible clusters gathered near $75,000 and approximately $74,400–$74,600. The latter area sat close to the daily lower Bollinger band, concentrating several chart references within a relatively small price range.
Market commentator Crypto Lens offered a more bearish scenario in a separate Nov. 7 post, projecting a path from $76,000 through $70,000 to $65,000 before a later recovery. His illustration labeled $65,000 a potential final bear trap and showed an eventual $110,000 target.
🚨 SOMETHING TERRIBLE WILL HAPPEN ON MONDAY$BTC will trap late buyers one last time before entering its final liquidation phase.
We've seen this before, and Bitcoin is now following EXACTLY the same pattern.
The next move is clear:
$76K → $70K → $65K → Final Bear Trap… pic.twitter.com/W3lCF9xshD
— Crypto Lens (@crypto_lens_) November 7, 2026
The $65,000 projection represents a decline of roughly 14.6% from Saturday’s $76,070 reading. It remains an attributed forecast, while the nearest downside levels visible on the current heatmap sit much closer to the market.
Bitcoin ETF withdrawals reach $1.28 billion for the week
Farside Investors’ data showed $411.9 million in net withdrawals from U.S. spot Bitcoin ETFs on Nov. 6. BlackRock’s IBIT lost $403 million, while Fidelity’s FBTC attracted $42.8 million.
Friday’s withdrawals followed a $430.2 million outflow on Thursday, taking the two-session total to $842.1 million. Thursday’s reversal had erased the previous session’s $74.6 million inflow.
Across all five trading sessions from Nov. 2 through Nov. 6, the funds recorded net withdrawals of $1.2817 billion. Wednesday was the only positive session.
Bitwise’s BITB lost $20.5 million on Friday, Ark’s ARKB shed $20.1 million, and Grayscale’s GBTC recorded $11.1 million in withdrawals. The remaining products listed in Farside’s table reported zero net flows that day.
Disclosure: This article does not represent investment advice. The content and materials featured on this page are for educational purposes only.





Leave feedback about this