

Ethereum price remained under pressure on Monday as ETF outflows and weakening technical indicators pushed traders to closely watch the key $2,000 support zone.
Summary
- Ethereum ETFs recorded more than $340 million in cumulative outflows over six trading sessions as ETH struggled to reclaim $2,150.
- Bitmine Immersion purchased roughly 71,672 ETH worth $154 million last week, raising its holdings to 5.28 million ETH.
- CoinGlass liquidation data showed dense leverage clusters near the $2,150 resistance area and the lower $2,000 support zone.
According to data from crypto.news, Ethereum (ETH) traded around $2,112 at press time on May 19 after failing to reclaim the important $2,150 resistance area earlier in the session. The asset has now erased much of its recent rebound from April lows as broader risk appetite deteriorated across crypto markets.
One of the largest headwinds for Ethereum has been the continued weakness in spot ETF demand. Over the past six trading sessions, U.S.-listed spot Ethereum ETFs have recorded more than $340 million in cumulative net outflows, signaling that institutional appetite for ETH exposure remains subdued.
Per data from SoSoValue, BlackRock’s ETHA led Monday’s withdrawals with roughly $55.4 million in net outflows, followed by $14.7 million exiting Fidelity’s FETH and another $10 million from Grayscale’s Ethereum products.
The persistent ETF bleed comes as broader macroeconomic conditions have become increasingly unfavorable for speculative assets. U.S. 10-year Treasury yields recently surged to 4.59%, their highest level in months, encouraging investors to rotate capital away from volatile assets like cryptocurrencies and toward safer yield-bearing government debt.
At the same time, inflation concerns have intensified following hotter-than-expected April CPI data showing annual inflation running at 3.8%. Sticky inflation has reinforced expectations that the Federal Reserve may keep interest rates elevated for longer than markets had previously anticipated.
Energy markets have also emerged as an increasingly important driver for Ethereum price action. Brent crude oil recently climbed near $111 per barrel as geopolitical tensions involving the United States and Iran continued escalating.
Several analysts now believe Ethereum’s unusually strong inverse correlation with oil prices has become one of the dominant macro forces influencing ETH performance during recent weeks.
Tom Lee, chairman of Ethereum treasury firm Bitmine Immersion, recently argued that rising oil prices were largely responsible for Ethereum’s latest weakness.
“ETH inverse correlation to oil is the highest ever,” Lee wrote in a post on X, adding that rising crude prices over the past six weeks coincided with falling ETH prices.
Lee additionally suggested that any reversal in oil markets could potentially help stabilize Ethereum.
“Oil reversing = ETH prices recovering,” he said.
Despite Ethereum’s recent decline, Bitmine Immersion continued aggressively accumulating ETH during the downturn. The company disclosed that it purchased approximately 71,672 ETH worth roughly $154 million last week, significantly increasing its holdings from the previous week’s 26,000 ETH acquisition.
The latest purchase brought Bitmine’s total Ethereum holdings to nearly 5.28 million ETH, representing approximately 4.37% of Ethereum’s circulating supply. The scale of the accumulation remains notable because Lee had previously indicated the company planned to slow the pace of its ETH purchases.
Bitmine and Michael Saylor’s Strategy remain among the few large digital asset treasury firms still actively increasing crypto exposure during the broader market sell-off.
Meanwhile, traders are increasingly focusing on short-term technical levels as Ethereum attempts to hold above the psychologically important $2,000 support area.
Crypto analyst Ted Pillows recently highlighted the importance of Ethereum reclaiming the $2,150 region to avoid a deeper correction.
Derivatives positioning suggests traders remain heavily focused on those nearby levels. CoinGlass liquidation heatmap data shows dense leverage clusters concentrated near both the $2,150 resistance region and the lower $2,050–$2,000 support zone.
Such liquidity pockets frequently attract short-term price action because heavily leveraged positions create large concentrations of stop-loss orders and forced liquidation triggers.
Why is Ethereum struggling to reclaim $2,150?
On the weekly chart, Ethereum continues trading below a long-term descending resistance trendline that has remained intact since late 2024, indicating that sellers still control the broader market structure.
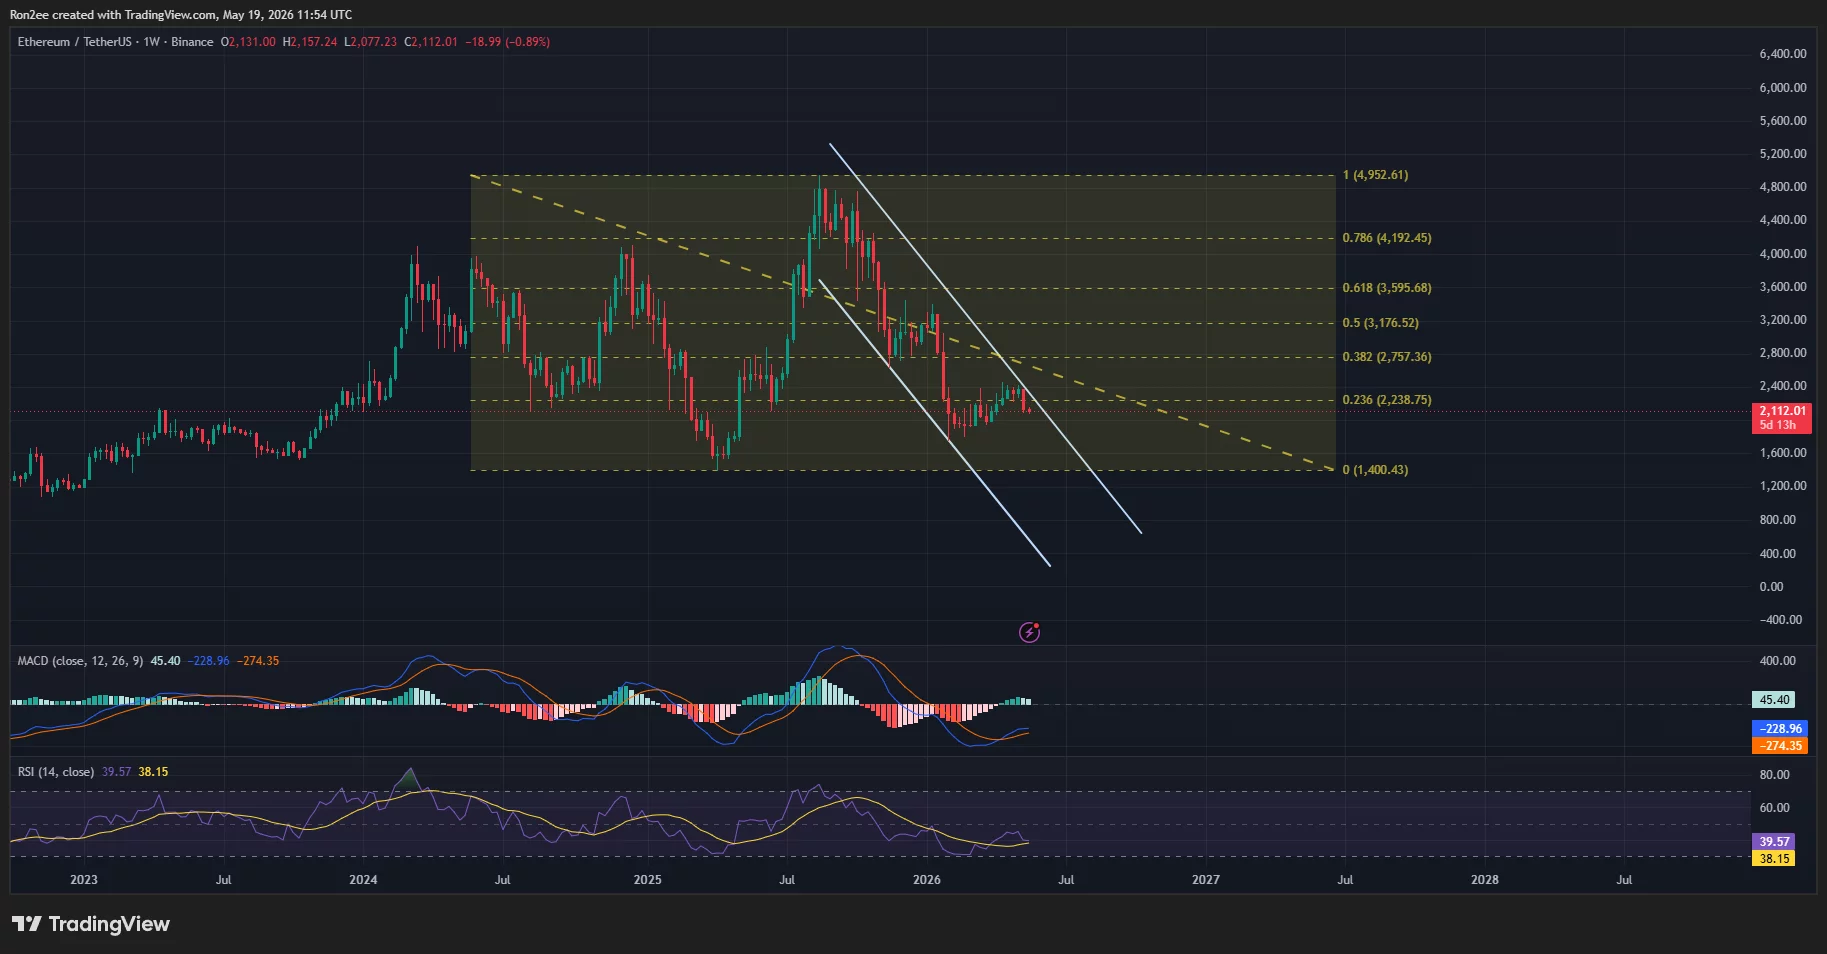
The chart also shows ETH struggling below the 0.236 Fibonacci retracement level near $2,238, which has repeatedly acted as a major resistance region throughout recent recovery attempts.
Failure to reclaim Fibonacci resistance levels during relief rallies often signals that bullish momentum remains weak rather than establishing a sustainable trend reversal.
Ethereum additionally remains trapped inside a broader descending channel formation visible on the weekly timeframe. Price recently attempted to break above the channel’s upper boundary before facing another rejection near the $2,300 region.
That rejection reinforced the current lower-high structure that has defined Ethereum’s broader downtrend over recent months.
Momentum indicators also continue favoring the bears. The MACD indicator remains in negative territory despite showing slight stabilization over recent sessions. The MACD line continues trading below the signal line, suggesting bearish momentum has not yet fully reversed.
Meanwhile, the Relative Strength Index remains below the neutral 50 level on the weekly timeframe. The RSI currently sits near the upper 30s, indicating weak momentum conditions without yet entering deeply oversold territory.
That distinction remains important because markets often experience stronger relief rallies only after RSI conditions become significantly oversold and seller exhaustion begins appearing more clearly.
Ethereum’s current RSI structure instead suggests the market may still remain vulnerable to additional downside volatility before establishing a stronger bottom.
Broader market participation has also weakened alongside price action. Ethereum futures traders have increasingly reduced leveraged positioning following repeated failed breakout attempts above the $2,200 region. Reduced speculative participation often limits the strength of short-term recovery rallies because fewer traders are willing to aggressively add bullish exposure.
At the same time, rising Treasury yields continue draining liquidity from digital assets more broadly. Higher yields increase opportunity costs for holding non-yielding assets like Ethereum, especially during periods of elevated macroeconomic uncertainty.
Could liquidation pressure drag Ethereum below $2,000?
Liquidation dynamics continue pointing to heightened volatility around current ETH price levels.
CoinGlass heatmap data reveals one of the largest nearby liquidity concentrations sitting around the $2,150 region, which aligns closely with the resistance level identified by Ted Pillows.
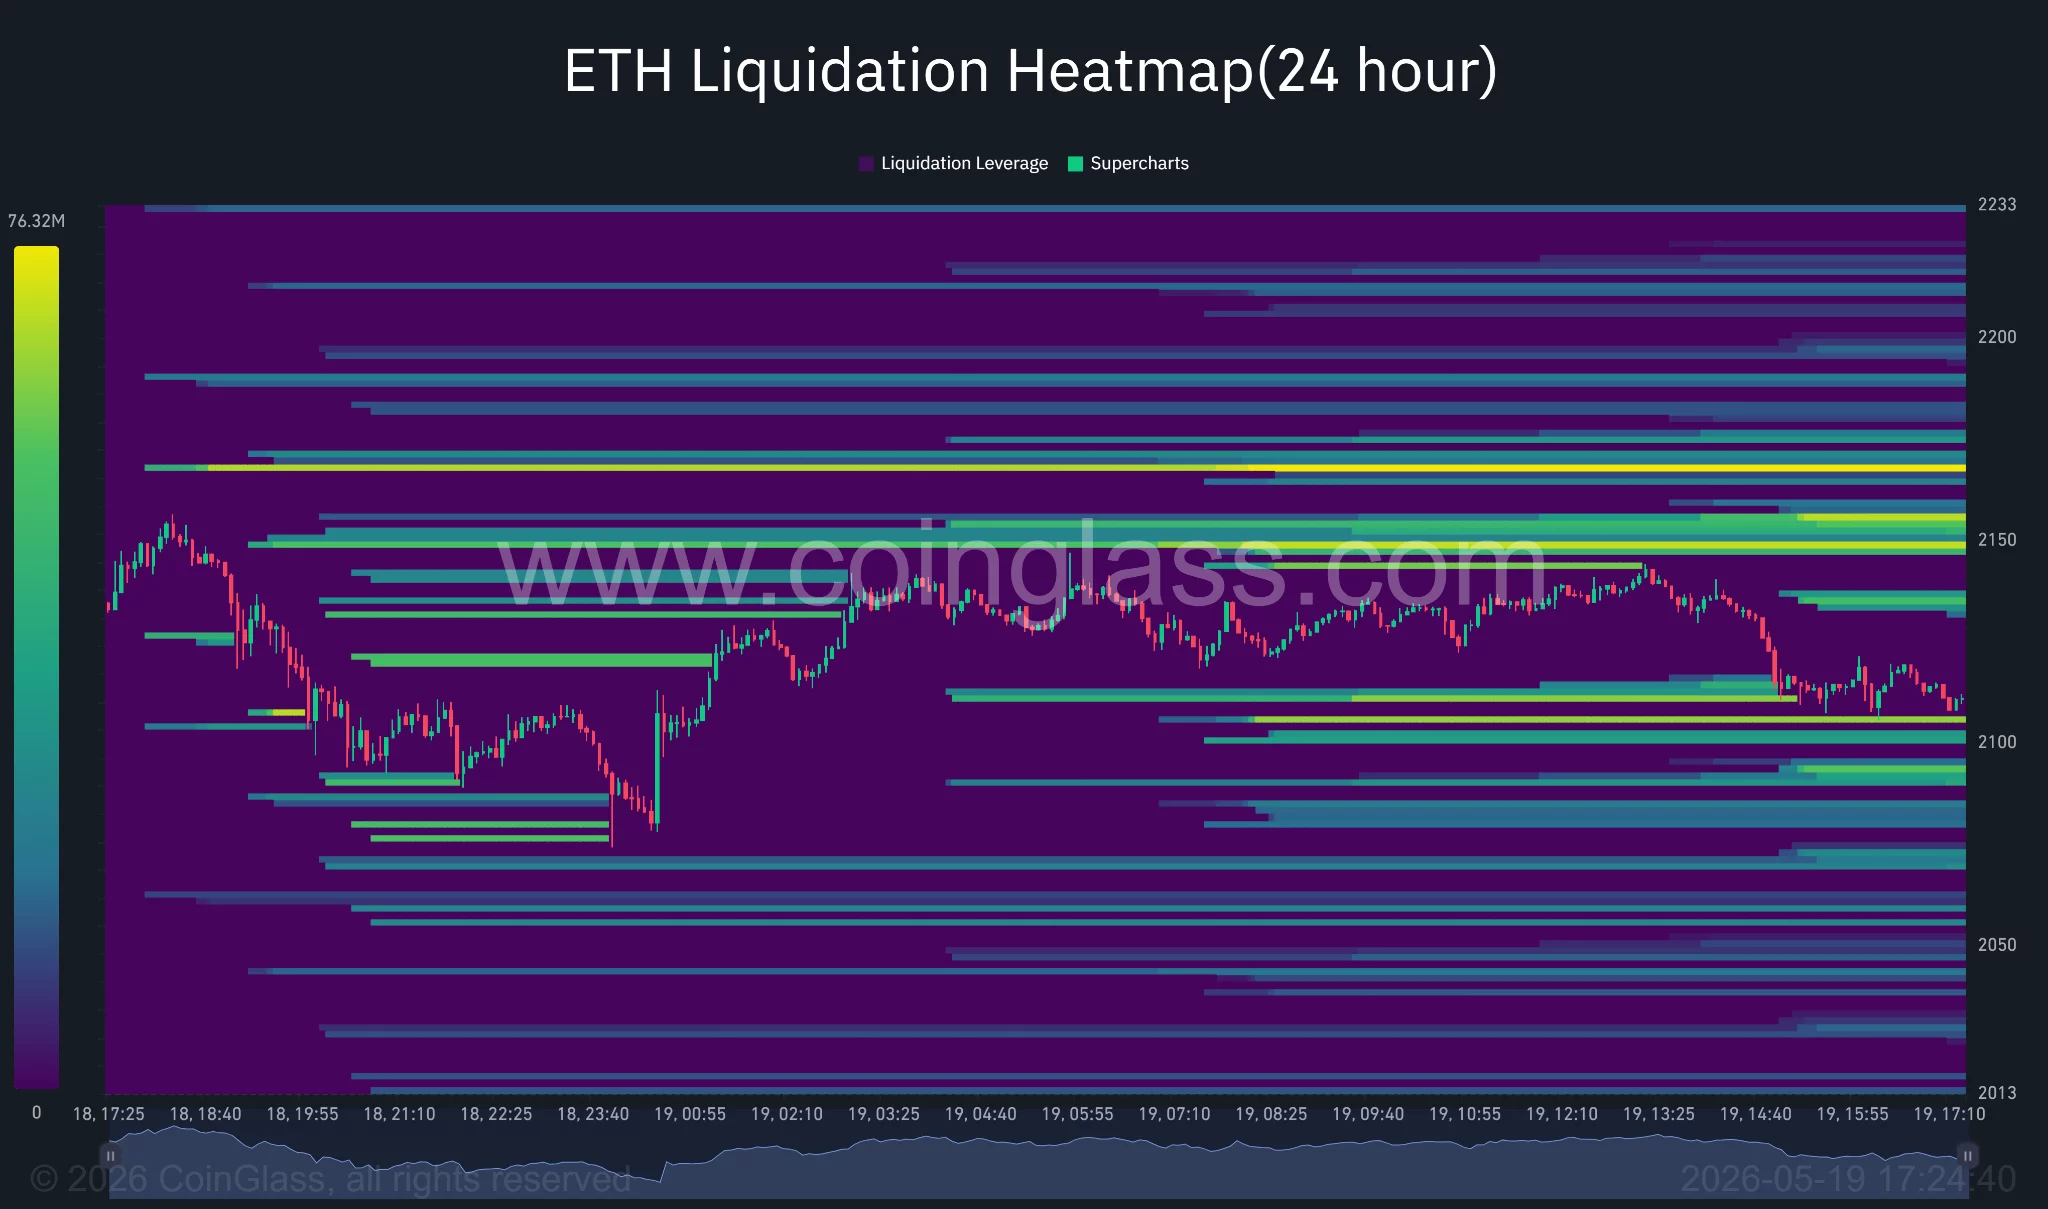
If Ethereum successfully reclaims that area, short liquidations could accelerate upside momentum toward the next major liquidity zone near $2,250.
However, the downside liquidity structure remains equally important.
Another dense liquidation pocket has formed near the $2,050–$2,000 region, indicating that a breakdown below current support could trigger a new wave of forced long liquidations.
That dynamic becomes especially important in crypto markets because perpetual futures traders frequently use significantly higher leverage compared to traditional financial markets.
If leveraged long positions near current levels begin unwinding aggressively, Ethereum could experience a rapid move lower toward the next major support cluster.
The psychological importance of the $2,000 level also increases the probability of heightened volatility around that region. Round-number price levels often attract large concentrations of trader positioning and stop-loss activity.
At the same time, Ethereum’s broader structural support still sits considerably lower near the 0 Fibonacci retracement level around $1,400 on the weekly chart. While that level remains distant from current prices, it represents a major longer-term support area traders may monitor if macro conditions deteriorate further.
Broader sentiment across altcoins has similarly weakened as investors continue rotating toward safer assets. Many traders have shifted capital toward cash, bonds, and defensive positioning following the recent surge in oil prices and Treasury yields.
The ongoing ETF outflow trend additionally suggests institutional investors remain cautious toward Ethereum despite continued corporate accumulation from firms like Bitmine Immersion.
Still, some analysts continue viewing the current decline as part of a broader consolidation phase rather than the beginning of a full long-term bear cycle.
Corporate treasury accumulation has remained one of the few constructive signals supporting Ethereum during the latest market downturn. Bitmine and Strategy remain among the limited number of major digital asset treasury firms still actively accumulating crypto despite worsening macro conditions.
For now, however, Ethereum’s short-term structure remains fragile.
If ETH fails to reclaim the $2,150 resistance region soon, bears could increasingly target the key $2,000 psychological support next. A confirmed breakdown below that area may then expose Ethereum to a deeper correction toward lower historical support zones.
Disclosure: This article does not represent investment advice. The content and materials featured on this page are for educational purposes only.


Leave feedback about this